
Analyzing Finance Job Market
Technologies:
![]()
![]()
![]()
![]()
![]()
Data Manipulation Library:
Pandas
Data Visualization Libraries:
Seaborn, Plotly
Below is the Jupyter Notebook for this project, generated with Jupyter2Svelte:
Finance Job Market Analysis 
Purpose 
As a finance and management information systems major I wanted to learn more about the current (2022) job market before entering within the next couple years.
Questions 
- Where are the most jobs located?
- Which industries have the most jobs?
- How can I best prepare myself for getting a job, what skills are in demand beyond an education in Finance?
- Would my MIS degree make me more marketable?
Data Collection 
For this project I developed a Python script, linkedin-job-scraper, to scrape public job listings on LinkedIn. LinkedIn is one of the most popular platforms for job seekers, making it one of the best websites to gather data on the job market.
Methodology 
From September 28th through October 4th 2022, I scraped LinkedIn's job listings each day with the search keyword "Finance" and location of United States. Filtering for the last 24 hours, the seniority/experience levels of Internship, Entry Level, and Associate with the job types of Full Time, Internship, and Other. I was looking to collect information on Full Time jobs available to those with about 0-3 years experience in the field ("entry jobs") and these filters would produce the most relevant data for my questions. Queries used LinkedIn's default "Most relevant" sorting in an attempt to get the best data pertaining to the "Finance" keyword.
Because LinkedIn will only display up to 1000 listings per search, I was unfortunately unable to scrape the entirety of the listings posted each day. I used separate search queries for each seniority level and further broke down those queries by filtering each for remote, hybrid, or on-site for the widest coverage. Gathering more data would not be possible without using highly specific filters introducing bias.
Data Structure 
| Col | Definition |
|---|---|
| date_scraped | date the listing was scraped |
| title | title of the job listing |
| full_url | LinkedIn URL of the job posting |
| company | company name |
| company_url | company's LinkedIn URL |
| location | job's location |
| description | raw HTML of the job's description |
| seniority_level | job's seniority level |
| employment_type | job's employment type (Full Time, Part Time etc.) |
| job_function | job's expected functions |
| industries | industries the company is in |
import pandas as pd
import glob

files = glob.glob("data/*.csv")

dfs = []
for file in files:
    dfs.append(pd.read_csv(file))

linkedin = pd.concat(dfs)
display(linkedin.head())
linkedin.describe()| date_scraped | title | full_url | company | company_url | location | description | seniority_level | employment_type | job_function | industries | |
|---|---|---|---|---|---|---|---|---|---|---|---|
| 0 | 2022-10-04 | Quantitative analyst (finance) | https://www.linkedin.com/jobs/view/quantitativ... | Lucas Group, A Korn Ferry Company | https://www.linkedin.com/company/lucas-group?t... | Charlotte, NC | \n <p>Lucas Group, a Korn Ferry company... | Associate | Full-time | Finance | Banking |
| 1 | 2022-10-03 | Accounting and finance associates | https://www.linkedin.com/jobs/view/accounting-... | EVERESTX Talent Solutions | https://www.linkedin.com/company/everestxtalen... | Pennsylvania, United States | \n <strong>Overview of the Role:</stron... | Not Assigned | Not Assigned | Not Assigned | Not Assigned |
| 2 | 2022-09-28 | Associate/ Consulting Associate - Litigation, ... | https://www.linkedin.com/jobs/view/associate-c... | Charles River Associates | https://www.linkedin.com/company/charles-river... | Washington, DC | \n <strong>About Charles River Associat... | Entry level | Full-time | Legal | Business Consulting and Services |
| 3 | 2022-09-28 | Associate/ Consulting Associate - Litigation, ... | https://www.linkedin.com/jobs/view/associate-c... | Charles River Associates | https://www.linkedin.com/company/charles-river... | Chicago, IL | \n <strong>About Charles River Associat... | Entry level | Full-time | Legal | Business Consulting and Services |
| 4 | 2022-10-04 | Senior Financial Analyst (Remote) | https://www.linkedin.com/jobs/view/senior-fina... | Capital Search Group | https://www.linkedin.com/company/capital-searc... | McLean, VA | \n Microsoft has become a corporate lea... | Not Assigned | Not Assigned | Not Assigned | Not Assigned |
| date_scraped | title | full_url | company | company_url | location | description | seniority_level | employment_type | job_function | industries | |
|---|---|---|---|---|---|---|---|---|---|---|---|
| count | 60017 | 60017 | 60017 | 60016 | 60017 | 60017 | 60016 | 51890 | 52288 | 52288 | 52288 |
| unique | 7 | 12294 | 29607 | 7205 | 7213 | 3071 | 14787 | 6 | 4 | 693 | 1009 |
| top | 2022-09-30 | Remote Tax Professional | https://www.linkedin.com/jobs/view/finance-and... | Aston Carter | https://www.linkedin.com/company/aston-carter?... | United States | \n <strong><u>What You'll Do...<br><br>... | Associate | Full-time | Accounting/Auditing and Finance | Not Assigned |
| freq | 11299 | 2443 | 7 | 3339 | 3339 | 3738 | 2474 | 23092 | 40980 | 10160 | 9708 |
Drop Duplicates 
Out of the 31,383 job listings that were scraped, 29,607 were unique
linkedin.drop_duplicates(subset="full_url", inplace=True)
linkedin.describe()| date_scraped | title | full_url | company | company_url | location | description | seniority_level | employment_type | job_function | industries | |
|---|---|---|---|---|---|---|---|---|---|---|---|
| count | 29607 | 29607 | 29607 | 29607 | 29607 | 29607 | 29606 | 29400 | 29422 | 29422 | 29422 |
| unique | 7 | 12294 | 29607 | 7205 | 7213 | 3071 | 14647 | 6 | 4 | 691 | 1000 |
| top | 2022-09-30 | Remote Tax Professional | https://www.linkedin.com/jobs/view/quantitativ... | Aston Carter | https://www.linkedin.com/company/aston-carter?... | United States | \n <strong><u>What You'll Do...<br><br>... | Associate | Full-time | Not Assigned | Not Assigned |
| freq | 5669 | 1214 | 1 | 1749 | 1749 | 1833 | 1229 | 11325 | 20245 | 8380 | 8381 |
Handle Nulls 
linkedin.isna().sum()date_scraped 0 title 0 full_url 0 company 0 company_url 0 location 0 description 1 seniority_level 207 employment_type 185 job_function 185 industries 185 dtype: int64
First lets drop the row with the missing description.
linkedin.dropna(subset="description", inplace=True)
linkedin.isna().sum()
date_scraped 0 title 0 full_url 0 company 0 company_url 0 location 0 description 0 seniority_level 207 employment_type 185 job_function 185 industries 185 dtype: int64
I will fill the rest of the missing data with the string "Not Assigned"
linkedin.fillna("Not Assigned", inplace=True)Data Types 
linkedin.info(show_counts=False)Int64Index: 29606 entries, 0 to 4625 Data columns (total 11 columns): # Column Dtype --- ------ ----- 0 date_scraped object 1 title object 2 full_url object 3 company object 4 company_url object 5 location object 6 description object 7 seniority_level object 8 employment_type object 9 job_function object 10 industries object dtypes: object(11) memory usage: 2.7+ MB
Remove Unnecessary listings 
If a listing does not mention finance in it's title or it's description, the listing can be discarded as only finance related job postings are relevant.
# Drop rows that do not mention finance, "financ" is chosen to include words such as "financial"
def drop(x):
    if 'financ' in x["description"].lower() or 'financ' in x["title"].lower():
        return True
    return False

linkedin = linkedin[linkedin.apply(drop, axis=1)]
Export cleaned data 
After cleaning we are left with 28,634 listings out of the 31,383 originally scraped
display(linkedin.shape[0])
linkedin.to_csv("data/cleaned.csv", index=False)
28634
import pandas as pd

# Visualization
%matplotlib inline
import seaborn as sns

linkedin = pd.read_csv("data/cleaned.csv")

display(linkedin.head(1))
linkedin.describe()| date_scraped | title | full_url | company | company_url | location | description | seniority_level | employment_type | job_function | industries | |
|---|---|---|---|---|---|---|---|---|---|---|---|
| 0 | 2022-10-04 | Quantitative analyst (finance) | https://www.linkedin.com/jobs/view/quantitativ... | Lucas Group, A Korn Ferry Company | https://www.linkedin.com/company/lucas-group?t... | Charlotte, NC | \n <p>Lucas Group, a Korn Ferry company... | Associate | Full-time | Finance | Banking |
| date_scraped | title | full_url | company | company_url | location | description | seniority_level | employment_type | job_function | industries | |
|---|---|---|---|---|---|---|---|---|---|---|---|
| count | 28634 | 28634 | 28634 | 28634 | 28634 | 28634 | 28634 | 28634 | 28634 | 28634 | 28634 |
| unique | 7 | 11956 | 28634 | 6985 | 6992 | 3027 | 14095 | 6 | 4 | 670 | 975 |
| top | 2022-09-30 | Remote Tax Professional | https://www.linkedin.com/jobs/view/quantitativ... | Aston Carter | https://www.linkedin.com/company/aston-carter?... | United States | \n <strong><u>What You'll Do...<br><br>... | Associate | Full-time | Not Assigned | Not Assigned |
| freq | 5568 | 1214 | 1 | 1589 | 1589 | 1792 | 1229 | 10997 | 19586 | 8293 | 8294 |
Locations 
locations = pd.DataFrame(linkedin["location"].value_counts()).reset_index()
locations.rename(columns={"index": "Location", "location": "Count"}, inplace=True)
palette = reversed(sns.color_palette("Blues", 10))
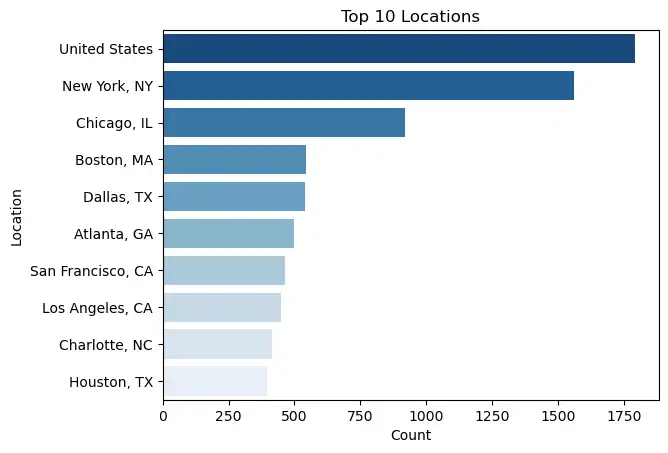
sns.barplot(data=locations.iloc[:10], y="Location", x="Count", palette=palette).set(title='Top 10 Locations')[Text(0.5, 1.0, 'Top 10 Locations')]
import plotly.graph_objects as go

# Drop location "United States"
locations.drop(index=0, inplace=True)

# Get State Instead of City and State
locations["Location"] = locations["Location"].map(lambda x: x[-2:])
locations = locations.groupby(locations["Location"]).aggregate('sum').reset_index()

# Map Figure
fig = go.Figure(data=go.Choropleth(
    locations=locations["Location"],
    z=locations["Count"],
    locationmode='USA-states',
    colorscale='Blues',
    autocolorscale=False,
    marker_line_color='black',
))

fig.update_layout(
    title_text='Job Listings by State',
    geo = dict(
        scope='usa',
))

fig.show()
Jobs with "United States" as the location are most likely remote positions. New York City and Chicago have a much higher share of jobs relative to other cities. Since New York City and Chicago are the homes of the major US security markets, it makes since that those 2 cities would have the greatest number of finance jobs.
The states of California, New York, Texas, Illinois, and Florida have the most jobs.
Industries 
linkedin["industries"].value_counts()Not Assigned 8294
Staffing and Recruiting 3112
Financial Services 1691
Financial Services and Retail 1120
Accounting 924
...
Newspaper Publishing, Online Audio and Video Media, Book and Periodical Publishing 1
Research Services, Staffing and Recruiting, Executive Offices 1
Staffing and Recruiting, Retail, Hospitality 1
Financial Services, Biotechnology Research, Pharmaceutical Manufacturing 1
Consumer Services, Retail, Hospitality 1
Name: industries, Length: 975, dtype: int64Not Assigned can be dropped. Also, some listings have multiple different industries separated by a comma.
industries = []
def get_industries(x):
for industry in str(x).split(', '):
if "Not Assigned" not in industry:
industries.append(industry)
# Derive industries
linkedin["industries"].map(get_industries)
industries = pd.Series(industries, name="Count").value_counts().reset_index()
industries.rename(columns={"index": "Industry"}, inplace=True)
palette = reversed(sns.color_palette("Blues", 15))
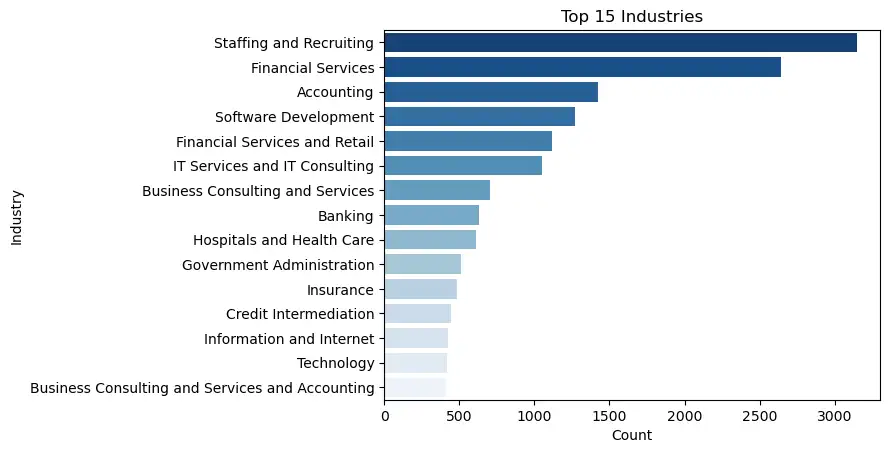
sns.barplot(data=industries.iloc[:15], y="Industry", x="Count", palette=palette).set(title='Top 15 Industries')[Text(0.5, 1.0, 'Top 15 Industries')]
linkedin["company"].value_counts()Aston Carter 1589
H&R Block 1278
Grant Thornton LLP (US) 728
RemoteWorker US 620
PwC 474
...
Eureka Multifamily Group 1
University of Phoenix 1
5th Avenue Recruiting 1
JES Holdings, LLC 1
Jamestown 1
Name: company, Length: 6985, dtype: int64Staffing/ Recruiting is interestingly the most common industry making postings. This is likely due to staffing firms making many postings, as several of the most repeated companies in the dataset are staffing firms.
Besides Staffing/ Recruiting, many of the top 15 industries are directly in the financial industry as expected.
Software development, IT, Information/Internet, and Technology where information systems domain knowledge may be useful make up numbers 4, 6, 12, and 13 respectively.
Skills 
import re

# Tuple containing the skill name and it's regex pattern
# 0 is the name and 1 is the regex pattern
skills_search = [
    ('Data Analysis', 'data anal'),
    ('SQL', 'sql'),
    ('Database', 'database'),
    ('Excel', 'excel |excel.|excel,'),
    ('Tableau', 'tableau'),
    ('Power BI', 'power bi')
]

skills = []
def get_skills(x):
    for skill in skills_search:
        if re.search(skill[1], x) != None:
            skills.append(skill[0])

linkedin["description"].map(get_skills)

skills = pd.Series(skills, name="Count").value_counts().reset_index()
skills.rename(columns={"index": "Skill"}, inplace=True)

skills['% of Listings'] = skills['Count'] / linkedin.shape[0] * 100

length = len(skills_search)
palette = reversed(sns.color_palette("Blues", length))
sns.barplot(data=skills.iloc[:length], y="Skill", x='% of Listings', palette=palette).set(title='Most In Demand Skills')
[Text(0.5, 1.0, 'Most In Demand Skills')]
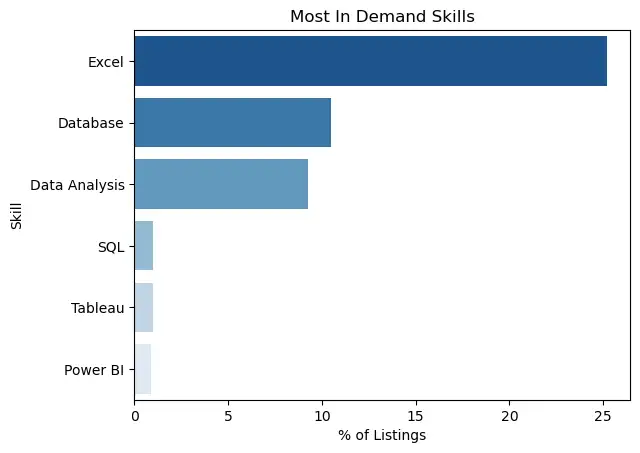
Excel is a must-have skill, it is mentioned in 25% of the job listings.
Findings 
Where are the most jobs located? 
New York City and Chicago have the greatest proportion of the jobs relative to other cities in the United States.
The states of California, New York, Texas, Illinois, and Florida have the most jobs overall.
Which industries have the most jobs? 
Unsurprisingly jobs directly in the financial services industry are the most common, but tech is common as well. Software development, IT, Information/Internet, and Technology make up numbers 4, 6, 12, and 13 respectively.
How can I best prepare myself for getting a job, what skills are in demand beyond an education in Finance? 
Excel is the most in demand skill, being mentioned in 25% of the job descriptions. Database, and Data Analysis are second and third, both around 10%.
SQL, Tableau, and Power BI were mentioned in about 1% of the postings, however these skills may set a job candidate apart from others seeking the same role.
Would my MIS degree make me more marketable? 
Database knowledge and data analysis skills are high in demand which are topics covered in the MIS degree program. Also, IT and tech are in the top 15 industries and in these industries information systems domain knowledge may be useful.